Session DEV04
Benchmarking FoxPro Performance
By
Ted RocheOverview
There are three ways to do almost anything in FoxPro, but which is the most efficient? This session will examine techniques for optimizing overall application performance through benchmark and volume testing, code coverage analysis, and will discuss alternatives such as distribution of processing and interface techniques to improve perceived performance.
Introduction
"I don’t get it. It ran fine on my machine."
"Gee, I tested it with 100 records and it was a lot faster than this…"
FoxPro programmers often get themselves into trouble when they assume that a system they are developing will run fine on a client's system just as it does on their development machine. Developers are often astounded when an application runs at a snail's pace on a client's 486/66, 16 Mb RAM machine when it ran like greased lightening on their Sextium-266 machine with a gig of RAM.
Issues also come up when the client tries to run the end-of-quarter closing, processing a million record file, when the developer tested the routine with the 12 records he was willing to type in.
In this document, I'll try to cover some of the issues you can be thinking about during the development cycle to ensure that your code will run at an adequate speed when and where it counts - in front of the client. We'll talk about how to identify slow processes, and more closely examine them to determine possible causes and cures.
Contents
Performance Issues: Data-based issues & Rushmore Interface issues: LockScreen & tricks
Overall tuning: More is Better Brute Force Benchmarking Code Coverage Analysis
The issues of tuning data-based query and processing power to take advantage of Rushmore optimization has been covered many times in conferences as well as in many books and magazines, so I will only give it cursory coverage here. If there is any doubt in this area, review the Developer's Guide, Chapter 18, for guidance.
Whenever a table is read using a SQL SELECT or FOR clause, Rushmore attempts to determine the records needed in the result set purely from reading the much smaller .CDX file. However, if SET DELETED is ON (typical of many applications, making DELETED records "invisible"), the final result set must be generated by reading every single record, to determine if the deleted flag (first byte of each record) is set. This step can be eliminated completely if an index tag is created on the DELETED() status, as in:
INDEX ON DELETED() TAG DelTag
Rushmore attempts to determine the optimal way to retrieve records specified in a SQL statement or FOR clause by reading the arguments on the left side of the WHERE or FOR clause and trying to match them exactly to the arguments used to create index tags.
TIP: Rushmore cannot use "conditional" index expressions which use the FOR clause, nor will it use index expressions containing NOT. Avoid these if possible. If you must create these indexes, consider creating a second, "plain" index, for use with Rushmore.
SYS(3054) is a new function exposed in Visual FoxPro 5.0. Calling SYS(3054,1) will cause information on Rushmore's use of indexes for joins to be displayed to the screen. SYS(3054,11) will display similar information on filtering criteria. You may also want to check out the other DevCon session, Using SQL-SELECT Effectively in VFP 5
February 1997's edition of FoxTalk had an excellent article by Flavio Almeida and Walter Loughney, "Set Turbo On: How Visual FoxPro Memory Usage Affects Performance, " that gives a great explanation of how setting foreground and background memory limits on FoxPro can significantly affect performance.
I once had the difficult task of speeding up an enormous Foxbase application. It was a massive and abstract piece of work with everything - the forms, the menus, and even the validation - driven from tables (shades of the power tools!). The problem was that it was slow! Watching a form draw on the screen, component by component, was painful! The solution required a few days R&D, very little code, and the insertion of one function call into numerous points in the system.
The results were dramatic. Forms snapped into view. Menu selection was crisp and responsive. Upper management was pleased with the results, and data entry personnel estimated the system was four or five times faster.
How was this phenomenal speed-up accomplished? No processing code was improved. No Rushmore optimizations were added. In fact, the system ran just as slowly as it had run all along. The only change was that the Foxbase equivalent of LockScreen - SAVE SCREEN TO and RESTORE SCREEN FROM - was used to simulate a faster response. In the amount of time it took for the users to recognize the screen, determine what they were supposed to do and press the appropriate keys, the form had completed drawing and was ready to continue processing.
Interface performance is perceived performance. Be snappy! - We have all done it - clicked on a button to get some task started, and have nothing happen. Click again, maybe the computer didn't hear you. Again and again. Just when you're ready to reboot, the process fires - four times. Don't aggravate the customer - be responsive.
LockScreen speeds native VFP updates - set THISFORM.LockScreen True before updating or refreshing the form, then LockScreen False when all changes are completed. FoxPro repaints the screen once instead of many times, actually speeding up the application. This also provides a psychological speed-up, and the operator does not see each control refreshing, then another, then another…
For OCXs, move them off-screen to speed up refresh events - Most ActiveX controls are not aware and do not respond to LockScreen properties - they are, in effect, their own Windows applications, with their own responsibilities to update themselves. Some ActiveX controls, such as the TreeView, can be tricked into quicker response by locking the screen (with LockScreen, above), moving them off-screen (to 10000,10000, perhaps), updating the controls, moving them back on-screen and then unlocking the screen. Thanks to Ken Levy for this tip.
Overall tuning: More is Better
In some cases, developers will have written the best code they can, and performance will not be acceptable. Instead of tearing into the code and rewriting large portions of it in an attempt to improve performance, alternatives outside of coding should be considered. If the application is used in only a few machines, or a hardware fix can be applied to the server alone, the cost of the upgrade can be significantly less than the cost of the developers time. In addition, an overall throughput improvement will benefit not only this application, but also all other work done on the machines.
More disk space - Win32 applications use virtual memory based on available disk space. More, defragmented space can speed applications.
More RAM - memory chips are rated in nanoseconds, while disk access is in milliseconds, a million times slower. If your application is chugging away using disk swap space, additional RAM can make a dramatic difference.
More processor - consider a processor upgrade. While this is not often the limiting element in a FoxPro application, processor upgrades are available inexpensively, and can have surprising improvements in disk and video subsystem performance on some systems.
More network bandwidth - 100Base-T, 100 Mb/s networking, is becoming far more reasonable in price.
More disk I/O bandwidth - New variations of IDE and especially SCSI - Fast, Wide, Ultra and SCSI-III - promise disk throughput in the tens of megabits per second, excellent for processing large files. Combined with a large, smart disk controller with buffering and read-ahead behaviors, PC systems can approach the throughput or larger-scale systems. Look into controllers and technologies which off-load the work from the main processor.
More video performance - FoxPro can be a very graphic-intensive language, as it maintains the entire "client" area of its window itself, redrawing every control itself, unlike some systems which turn these tasks over to the operating system.
Benchmarking an application can be tricky. Care must be taken to identify that the right things are measured. If a routine combines an 250-millisecond I/O operation with processing which could take from 100 to 300 microseconds, it doesn't really matter how long the processing takes in the overall routine.
Repeat tests, as caching, memory load, other factors often interfere. Repeating exactly the same tests can give wildly different results, even on the same machine, as many other processes may be going on at the same time, interfering with the overall measurement. Similarly, if you want others to be able to repeat your tests, you should eliminate any many other running tasks as possible, and be sure to specify the exact hardware and software configuration used in the test.
FoxPro timer accuracy limited to milliseconds - so individual measurements rarely work.
Use large loops to determine which code works faster - running the same series of commands in a large loop helps smooth the measurement error or interference of other tasks into a more fair average.
Examples:
The basic technique is to store the time just before and just after the test to determine the elapsed time:
local i,x
x = 0
nStart = SECONDS()
* do testing
FOR i  = 1 to 10000
   x=x+1
ENDFOR &&* i  = 1 to 10000

nEnd = SECONDS()
wait window "Elapsed: " + ltrim(str(nEnd-nStart,10,4))
This technique can be extended to compare two rival techniques:
* Macros.PRG
* Are Macros bad?

local lcSetTalk
local i, iLoopCount

iLoopCount = 10000

nStart = SECONDS()
FOR i = 1 to iLoopCount

   cSetTalk = SET("TALK")
   SET TALK OFF
   SET TALK &cSetTalk

ENDFOR &&* i = 1 to iLoopCount

lnTrial1 = SECONDS() - nStart

nStart = SECONDS()
FOR i = 1 to iLoopCount

   cSetTalk = SET("TALK")
   SET TALK OFF
   IF SET("TALK") <> cSetTalk
     if cSetTalk = "ON"
       SET TALK ON
     ELSE
       SET TALK OFF
     ENDIF
   ENDIF

ENDFOR &&* i = 1 to iLoopCount

lnTrial2 = SECONDS() - nStart

=Result("With Macros","Without Macros",lnTrial1, lnTrial2)

* Results:

* with talk set off (less code for test 2) ~45% faster
* 1000 loops: 0.118, 0.060
* 10000     : 1.170, 0.580
*             1.248, 0.656
*             1.15,  0.659

* with talk set on: ~30% faster
* 10000       1.158, 0.981
*             1.332, 0.911
*             1.284, 0.913

* CONCLUSION: 9 lines of code without macros can be
*             ~40% faster than 3 lines with a macro.
* BUT: we are talking about a difference for a single
* run through the code of 50 microseconds
The Result UDF is a simple routine to display the results:
*****************************************************����*************
* Program....: RESULT.PRG
* Author.....: Ted Roche
* Date.......: July 12, 1997
* Compiler...: Visual FoxPro 05.00.00.0402 for Windows
* Abstract...: MessageBox of difference between two tests
**********************************************************************
LPARAMETERS tcTest1, ; && name of the first test
tcTest2, ; && name of the second test
tnTest1, ; && time for the first test
tnTest2 && time for the second test
LOCAL lcMessage
IF tnTest1 < tnTest2
lcMessage = tcTest1 + " is faster by " + ;
STR(100* (tnTest2-tnTest1)/tnTest2, 3,2) + " percent"
ELSE
lcMessage = tcTest2 + " is faster by " + ;
STR(100* (tnTest1-tnTest2)/tnTest1, 3,2) + " percent"
ENDIF
=MESSAGEBOX("Elapsed time for " + tcTest1 + ": " + str(tnTest1,9,3) + CHR(13) + ;
"Elapsed time for " + tcTest2 + ":" + str(tnTest2,9,3) + CHR(13) + ;
lcMessage , 64, "Results")
Code Coverage Analysis is a new feature added to Visual FoxPro 5.0, and while it is somewhat limited in its abilities to give us performance information, it can be of help. The primary purpose of code coverage is to allow the developer to verify that all lines of code have been tested (covered) as part of a comprehensive testing scheme. Start code coverage by issuing the command:
SET COVERAGE TO [filename] [ADDITIVE]
Note that there is no command to SET COVERAGE ON or OFF. SETting COVERAGE TO a file automatically turns the feature on, and issuing the SET command again with no filename turns it off. Code coverage produces a text file containing one line of comma-delimited values for each line of code that fired. These values are of the format:
duration, class, procedure, line, file
where the duration is an N(7,3) number of the time this command took, class is a 30-character class name, procedure is a 60-character string of the procedure file, line is the integer line number within the routine and file is the filename where the source was found. The file can be converted to a FoxPro table with a routine found in the Developer's Guide:
CREATE TABLE (tcTableName) ;
	(duration n(7,3), ;
	class c(30), ;
	procedure c(60), ;
	line i, ;
	file c(100))

APPEND FROM (tcLogName) TYPE DELIMITED
Similar output could be created in earlier versions of FoxPro 2.x and 3.x. The trick is to use the debugger's watch window to evaluate a low-level file write with each line of code executed. Issue the command:
lnHandle = FCREATE("cover2x.log")
to open the file. In the watch window, add the expression:
FPUTS(lnHandle, STR(SECONDS(),9,3) + "," + STR(LINENO()) + ","+PROGRAM())
Run the program of interest. When done, issue FCLOSE(lnHandle) to close the file, then a similar routine to the above can be used to convert the output to a DBF:
CREATE TABLE COVER2X (nTime N(9,3), ;
                      iLineNo N(5), ;
                      cProgram C(30), ;
                      nElapsed N(7,3))
APPEND FROM COVER2X.LOG TYPE DELIMITED

GO TOP
PRIVATE nOldTime
nOldTime = nTime
SCAN
  REPLACE nElapsed WITH (nTime-nOldTime)
  nOldTime = nTime
ENDSCAN
_COVERAGE system memory variable
The Visual FoxPro documentation discusses an _COVERAGE memory variable and states that it contains the Code Coverage Analyzer, COVERAGE.APP, by default, installed in the root directory of the VFP installation. Unfortunately, it seems that the Analyzer was dropped from the product. However, knowing the structure of the underlying tables, it is not impossible to write our own:

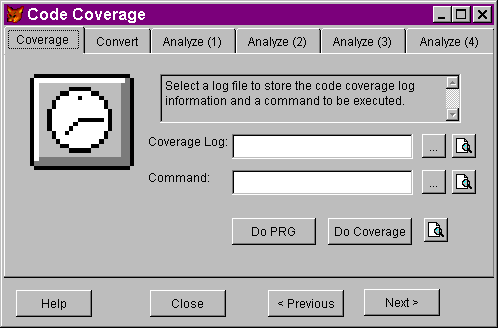
Figure 1: The Code Coverage Analyzer first tab
allows you to run code coverage against your code
All code for the Code Coverage Analyzer is included in the proceedings CD-ROM.
Analyzing the results of the code coverage process indicate that, like the problems run into with benchmarking, the accuracy of the time is questionable at best. Typically, 94 - 98% of the times recorded by the process are zero, and the remaining few percent seem to vary widely. Despite this, on large enough samples, there does seem to be some validity to comparing the average non-zero times of various commands. The presentation will show how code coverage was used to analyze and improve the performance of a timing critical application.

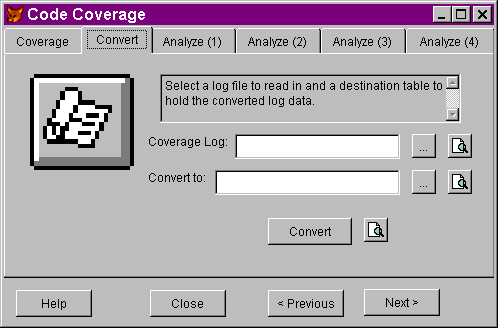
Figure 2: The Convert Tab of the Code Coverage Analyzer converts the output to a DBF

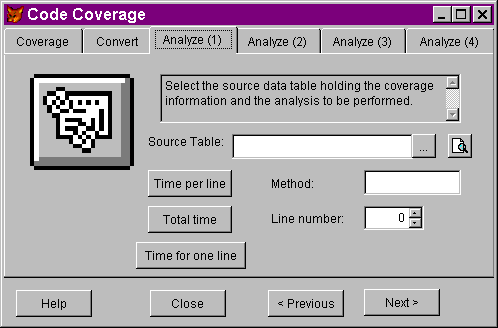
Figure 3: Converted to a DBF, it is easy to analyze the resulting information.
Let's review the options available and the priority in which they should be considered:
For performance tuning:
Cover the basics: Rushmore, Screen I/O - always consider Rushmore optimization options as you are designing tables and writing code. A DELETED() tag on every table is a necessity. Tags on every field in a table that gets used in a WHERE or FOR clause ensures optimal performance in nearly all cases. Setting LockScreen True and avoiding unnecessary I/O improves performance dramatically.
More is Better (and often cheaper) - improving the hardware on target platforms can often turn out to be a more economical move than overhauling a system to squeeze out additional performance improvements.
Benchmark suspected slow code - if you suspect or are unsure of the speed of a particular command or piece of code, benchmark it to determine how fast it will be. Remember to take the results with a grain of salt, as FoxPro measurements of time are not accurate and the artificiality of setting up a testing environment can skew the results.
Code Coverage Analysis to locate problems - while it is not its primary purpose, code coverage analysis can be used to get some relative benchmarks of code segments, and point to areas needing additional attention.
Ted Roche is the director of development at Blackstone Incorporated, a Microsoft Solution Provider based in Arlington, Massachusetts specializing in database development and network infrastructure using Microsoft BackOffice and Visual Tools. He is co-author, with Tamar Granor, of the critically acclaimed "Hacker's Guide to Visual FoxPro 3.0" from Addison-Wesley. Ted is a Contributing Editor for FoxPro Advisor magazine and co-authors the "Ask Advisor" column. He is a Microsoft Certified Solution Developer, a Microsoft Support Most Valuable Professional and a CompuServe Support Partner. Email: tedroche@compuserve.com, phone: (617) 641-0400.
Developer's Guide, Chapter 14, Testing and Debugging Applications - the only documentation on working with code coverage output.
Developer's Guide, Chapter 15, Optimizing Applications - this is a great chapter to read, read again, and bookmark for review for issues on Rushmore optimization and general coding techniques.
"Set Turbo On: How Visual FoxPro Memory Usage Affects Performance," FoxTalk magazine, February 1997