ADX304:
Graphing
with Visual FoxPro
Ted Roche, MCSD, MCSE, VFP MVP
Ted Roche & Associates, LLC
http://www.tedroche.com
![]()
If a picture is worth a thousand words, a graph can tell a very important story. Graphing is one of the most important functions of our database applications. The purpose of nearly every application is to produce useful output, and graphing is a great medium for converting lots of data into clearly expressed information.
In this session, we look at two graphing solutions supplied by Microsoft: Graph and Excel. There are many other solutions available from third-party manufacturers, but these two solutions can provide you with most of the expertise you will need to work with one of the other packages.
Microsoft Graph, or MSGraph, is an applet included with all versions of Microsoft Office. MSGraph is a funny, “half-class” application. It is unable to stand on its own. It must be embedded within another application in order to be displayed. I suspect that Microsoft deployed it originally as a “demonstration of technology” and didn't expect it to be used and deployed in applications. However, 10 versions have past, and MSGraph is here to stay. For this version of Office, anyway.
MSGraph has split into multiple objects, also, so be careful when you are reading documentation on charting within Microsoft office. There is also a Microsoft Chart Object, sometimes referred to as a Office WebComponent , which is a lighter-weight version of the graphing engine, better suited for the multiple threaded model of the web than the single-threaded MSGraph engine.
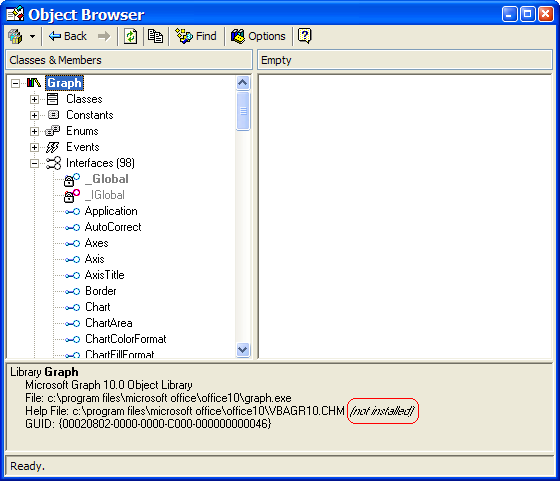
Figure 1: The Visual FoxPro Object Browser and the MSGraph Object Library. Note that help appears to be missing, but is only misplaced.
Start your exploration of MSGraph by opening it up in the Object Browser within Visual FoxPro. It should be listed as “Microsoft Graph” if you search for COM components. If it is not there, check to ensure that you have installed it in the Microsoft Office setup – it is an optional component. While you are within the setup, you will want to check to ensure that you have installed other optional components, such as the VBA Help for the applications you'll be working with.
The Object Browser (Figure 1) shows the methods, properties, interfaces, constants, and class definitions for the MSGraph object. Note that the help file, VBAGR10.CHM, is listed as “not installed.” It is installed, in fact, but not where it is expected. On my installation, I found it in a 1033 subdirectory of the expected path – you may find yours also in a corresponding subdirectory (1033 is the code page for US English).
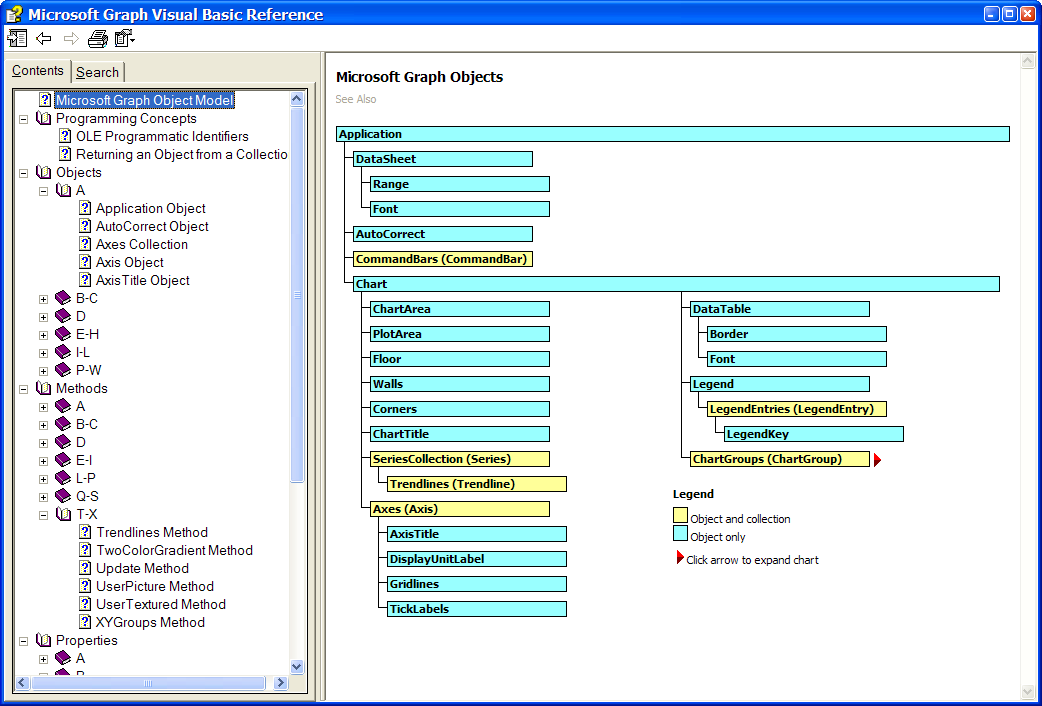
Figure 2: The MSGraph Help File (VBAGR10.CHM) must be installed as an optional component within the Microsoft Office install.
The Help File (Figure 2) is a handy reference to the MSGraph Object Model and its properties, methods and subsidiary objects.
_GenGraph or HOME()+”\Wizards\WzGraph.App” will start the Graphing Wizard on the currently open table. Start the Wizard from the menu (Tools|Wizards|All Wizards...) to pick the tables to work with. For a quick exercise or to get familiar with the MSGraph tool, you can directly generate a form with an embedded MSGraph object. However, the changes you make to this object and its data are not retained (unless you do something kludgey like “Save As” while manipulating the form. If you really want to save the data, it is better to use the Wizard to generate the basic structure you want to work with into a table you can then manipulate programmatically.
The complete source to the Graphing Wizard, as well as most of the other FoxPro-source-code components of the VFP development environment, are located in a ZIP file in the HOME()+”\Tools\xSource” directory. I un-ZIP that directory in place, and the path to the Graph Wizard is:
C:\Program
Files\Microsoft Visual FoxPro
8\Tools\
xsource\VFPSource\Wizards\wzgraph
The Graph By Record class in the Utilities.VCX of the FoxPro Foundation Classes provides the engine for the samples shown in the Solutions Sample Application. To start the sample applications, start the Task Pane Manager, select the Solutions Sample tab, and pick:
Foundation Classes: “create record-bound graphs” or
ActiveX | Automation: “Manipulate display characteristics of a graph”
ActiveX | Automation: “Refresh a graph in a form”
Clicking on these topics runs the demo, selecting the icon to the far right will bring the solution up in the appropriate editor so that you to examine how it works. The sample code included can serve as a good training tool, but these classes cannot be distributed with your application, and you probably would not want to. Use them as reference, though, to learn how to manipulate the graph.
The Wizards aren't performing any rocket science in the samples above. They either create an embeddable object or push data into a general field to get the MSGraph to appear. We can do this in code pretty simply:
CREATE CURSOR grafthis (cQuarter c(6), nSales n(5,2))
INSERT INTO grafthis VALUES ("2002Q1", 123.45)
INSERT INTO grafthis VALUES ("2002Q2", 78.90)
INSERT INTO grafthis VALUES ("2002Q3", 321.09)
INSERT INTO grafthis VALUES ("2002Q4", 87.65)
DO HOME(1)+"Wizards\WZGraph.App" && or (_GenGraph, if set)
or:
SELECT GrafThis
LOCATE
_vfp.DataToClip("GrafThis",4,3) && 4 records, tab-delimited
APPEND GENERAL gGraph CLASS "MSGraph.Chart" DATA _Cliptext
If you aren't familiar with it, the DataToClip() method of the VFP Application object lets you quickly copy VFP cursors to the clipboard. The second parameter specifies the number of records to copy (in this case, all four) and the third parameter specifies the format the data should be in, in this case with each field value separated with a tab, and each row (record) with a carriage return.
The APPEND GENERAL command appends data into a general field. Specify the class to create a new object. Skip the CLASS phrase to refresh an existing object with new data.
The best strategy for using MSGraph I have found is to create a set of “template” records with general fields of MSGraph objects that contain the styles and formats you need. Save these records and do not manipulate them directly. General fields, like all memo fields, are updated by appending more space onto the end of the memo file, and releasing the original location of data within the table, an effect known as “memo bloat.” To avoid memo bloat, preserve your original template records untouched, and create a temporary cursor to hold records you will manipulate for display and output.
The purpose of nearly all database management systems is to produce some form of output – work orders, invoices, analyses, or graphs. So, how do you get the graph you have produced out to the world?
The solution is pretty simple: use the Visual FoxPro Report Writer. Add an OLE Object to the report, set the Field property of the Picture dialog (called up by the Properties context-sensitive menu) to the name of the general field with your graph, and print the report!
TIP: If you are printing multiple details in the report, and want to regenerate an MSGraph general field for each detail object, perhaps by using a hidden UDF within the report, you may need to force VFP to re-read the general field. In some versions of VFP, the overly-aggressive caching of bitmaps caused all graph images to come out the same. Forcing a read of the record can be as simple as issuing the command GO RECNO(). In other cases, you may want to generate multiple records, and move through the table of records to display your result.
Microsoft Excel has an excellent charting engine built into it. It is very nearly identical to the Microsoft Graph engine, but it has the advantage of being hosted inside of an application with support for multiple pages, page layout, fine printing control, and VBA macro programming. If you have the option to deploy your solution on either MSGraph or MS Excel, the latter is probably a better choice, simply for the amount of documentation and support you'll be able to find.
The easiest way to learn Excel Automation coding is by using the Macro Recorder within the application to record the steps to perform the desired action. Copy the code from the Macro Editor within Excel and paste the code into the calling program. You'll need to adjust the way parameters are called (Automation uses parameters in one particular order, while VBA code can use named parameters without regard to order), adjust references to the called application, and tweak the code a bit to get it running, but it is a great start.
Run the Solutions Sample (DO FORM HOME()+”\Solutions\Solutions.APP” or select the Solutions Sample tab from the Task Pane Manager) and select:
ActiveX | Automation: “Automate Microsoft Word and Excel”
ActiveX | Automation: “Automate a Microsoft Excel Spreadsheet”
Here's the code used:
#DEFINE TAB CHR(9)
#DEFINE CRLF CHR(13)+CHR(10)
#DEFINE DOGS_LOC "Dogs"
#DEFINE CATS_LOC "Cats"
LOCAL nTotSeries,i
public oXLChart1
oXLChart1 = GetObject('','excel.chart')
oXLChart1.application.charts[1].haslegend = .F.
oXLChart1.application.visible = .t.
oXLChart1.application.worksheets(1).cells().clear
_cliptext = ""+TAB+CATS_LOC+TAB+DOGS_LOC+CRLF+;
"1994"+TAB+"11"+TAB+"22"+CRLF+;
"1995"+TAB+"33"+TAB+"44"+CRLF+;
"1996"+TAB+"55"+TAB+"55"+CRLF
oXLChart1.application.worksheets(1).cells(1,1).pastespecial
oXLChart1.application.charts[1].autoformat(-4100,1)
* Remove extra series added by Excel
nTotSeries = oXLChart1.application.charts[1].SeriesCollection().count
FOR i = m.nTotSeries to 4 STEP -1
oXLChart1.application.charts[1].SeriesCollection(m.i).delete
ENDFOR
oXLChart1.application.charts[1].haslegend = .T.
The Automation code is fairly straight-forward. A reference to Excel is created with GetObject, to get a handle to an running application or launch a new one. The chart's legend is turned off, the application is popped to the top by being made visible, and the cells are cleared and then filed with the contents of the clipboard, similarly to the way it was done above for the MSGraph example, but this time completely in VFP code.
The documentation for Microsoft Excel is comprehensive and thorough. The Excel Help File, available off the Help menu, includes a section for Programming Information (see Figure 3) which includes a detailed breakdown of the objects, methods and properties needed to manipulate charts within Excel.
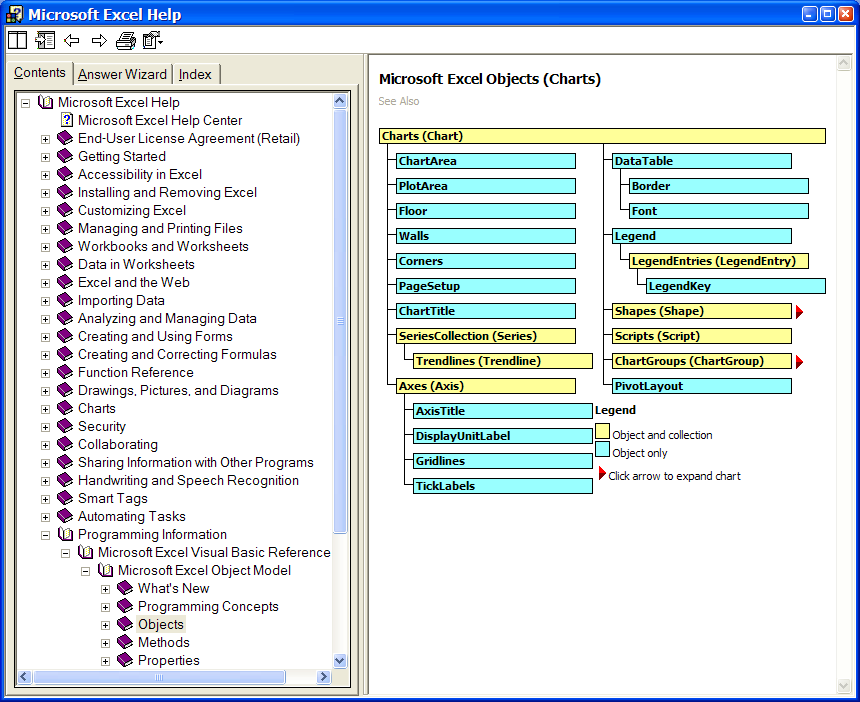
Figure
3: The Excel Help will include section on programming Excel, if you
specify to include the VBA Help files when installing Office.
The ideal situation for deploying your solution is to do as little as possible. The less you need to install or configure, the less likely you will run into trouble with the client's machines. However, reality intrudes, and you will probably spend some time configuring the machines to match the needs of your applications.
One of the biggest problems I find is that the target machines are often a mixture of different versions of operating systems and applications. If at all possible, you will want to require the most recent stable version of the OS and applications, dependent on what can be worked out with the machine's owners. Many clients have chosen to “lock down” or standardize on a particular version of software for stability and support reasons, for economic reasons, or because of licensing issues. Make sure that you understand what the criteria of your clients are before you attempt to deliver an OfficeXP solution for a client standardized on Office 2000.
Along those same lines, if you are delivering an application into an environment of mixed versions, ensure that your code does not contain version-dependent calls which could be asking for later versions of the software than is installed on the client's machine. Use calls like:
loGraph = Createobject(“Graph.Application”)
rather than:
loGraph = CreateObject(“Graph.Application.10”)
The latter call would only work on a machine with Office XP (or the MSGraph 10 runtime) installed, and fail on earlier machines. The first call would work on all machines that had Graph installed, and would invoke the most recent version. OLEControls inserted into a form or container suffer from this problem, of having the explicit class and version stored as its OLEClass property. The solution is a factory pattern where, instead of placing the control directly on the form, you use a placeholder that invokes the proper class for the environment.
Akins, Marcia, Andy Kramek, Rick Schummer, MegaFox: 1002 Things You Wanted To Know About Extending Visual FoxPro, Hentzenwerke Publishing, 2002, ISBN: 1-930919-27-1. Chapter Six: Creating Charts and Graphs details working with the MSChart object, MSGraph and Excel.
Egger, Markus, Advanced Object Oriented Programming with Visual FoxPro 6.0, Hentzenwerke Publishing, 1999, ISBN 0-96550-938-9. Chapter Four: Using Shrink-Wrapped Classes describe the FoxPro Foundation Classes for MSGraph.
Granor, Tamar and Della Martin, Microsoft Office Automation with Visual FoxPro, Hentzenwerke Publishing, 2000, ISBN 0-96550-935-0-3. This book is an excellent introduction to Automation, to Office and, in Chapter Nine, Excel charting, even if I was the technical editor.
Thalacker, Pamela, Advisor Answers column, FoxPro Advisor, April 2003. Pam does a great job of summarizing MSGraph manipulation in a few paragraphs.
Tufte, Edward, The Visual Display of Quantitative Information, Graphics Press; 2nd edition, May 2001, ISBN: 0961392142, Envisioning Information, Graphics Press, May 1990, ISBN: 0961392118, and Visual Explanations, Graphics Press, February 1997, ISBN: 0961392126. Important concepts to anyone trying to express information through graphics.
http://support.microsoft.com/default.aspx?scid=kb;en-us;302460 is a knowledgebase article titled “OFFXP: Microsoft Office XP Automation Help File Available” which discusses the very basics of Automation.
The Microsoft Office Resource Kit is available at:
Office XP: http://www.microsoft.com/office/ork/xp/
Office 2000: http://www.microsoft.com/office/ork/2000/default.htm
Office 97/98: http://www.microsoft.com/office/ork/home.htm
The
MSGraph help file is located online at:
http://msdn.microsoft.com/library/en-us/vbagr10/html/grtocObjectModelApplication.asp
Sample data from http://fox.wikis.com/wc.dll?Wiki~VFPConferenceAttendance~VFP
Ted Roche develops n-tier applications using Microsoft Visual FoxPro and other best-of-breed tools. He runs Ted Roche & Associates, LLC, http://www.tedroche.com, based in New Hampshire, USA, where his company offers software development, consulting, training and mentoring services. Ted is author of Essential SourceSafe, co-author of the award-winning Hacker’s Guide to Visual FoxPro series, and a contributor to five other FoxPro books. Ted is an MCSD, MCSE, and eight-time winner of the Microsoft MVP award. Email Ted at tedroche@tedroche.com.